This article will go over the biggest economic indicators in the US Session this week (starting Monday 31st of July), explaining what they are, and how they could potentially affect the markets.

Tuesday 1st August
9:45 AM
US S&P Manufacturing PMI
The US S&P Manufacturing PMI is a monthly economic indicator published by IHS Markit and associated with Standard & Poor's (S&P) division. It assesses the performance of the US manufacturing sector based on surveys of purchasing managers, providing a number above 50 for expansion and below 50 for contraction.
Last release (July 3rd) PMI came out much higher than forecast but was still in contraction at 49.
10:00 AM
US ISM Manufacturing PMI
The Institute for Supply Management (ISM) publishes a monthly economic indicator called the US ISM Manufacturing PMI that gauges the state of the American manufacturing industry. It is based on a survey of purchasing managers and provides a number that indicates whether the sector is expanding or contracting.
Last release (July 3rd), PMI came in below both the forecast and the previous, which sent the US Dollar down.
Difference Between S&P vs ISM Manufacturing PMI
Both Manufacturing PMI gauges provide a figure from a diffusion index (out of 100. 50 and above signifies expansion, whereas below 50 shows contraction).
The headline manufacturing PMI is a composite of five data points. These are New orders, Output, Employment, Suppliers' delivery times (inverted), and Stocks of purchases.
The ISM uses a straight average across all 5 components (listed above) to get the headline PMI number, whereas S&P uses the following weights: production (0.25), new orders (0.30), employment (0.20), supplier deliveries (0.15), and inventories (0.10).ISM uses a straight average across all 5 components (listed above) to get the headline PMI number.
What to Expect
ISM Manufacturing PMI has been coming in below forecast, and due to the US being near the end of the tightening cycle, a little improvement would not go amiss to secure a softer landing. Although, anything above 50 could be sending a warning to the Fed that the manufacturing sector could pose a problem for future inflationary readings and their goal of getting to 2%.
S&P Manufacturing, on the other hand, is in a reasonably good spot, indicating a cooling in the manufacturing sector, but prolonged time spent in contraction could add to fears of a hard landing.
US JOLTs Job Openings
The US Job Openings and Labor Turnover Survey, more commonly known as JOLTs, is a monthly report by the BLS of the US Departments of Labor counting job vacancies and separations, also including the number of workers voluntarily quitting employment. The BLS surveys 21,000 nonfarm businesses and government employers.
Simply put, it’s a monthly report from 21,000 businesses on their job openings, new hires, the number of employees who quit or were laid off, and any other form of labor turnover.
The last release of JOLTs had no impact on the markets; however, that doesn’t mean it can’t move markets. Jobs data is now being assessed by traders in two ways;
What to Expect
Overly strong reports may mean more inflationary pressure, which could cause the Fed to act.
Overly weak reports may mean the economy has taken a big hit, and recession fears may surface.
Wednesday 2nd August
8:15 AM ET
US ADP Employment Change
ADP Employment Change is a monthly report conducted by Automatic Data Processing, The report measures the monthly change in nonfarm private sector jobs in the US.
They survey approximately 460,000 companies and gather their data from the payroll information of their clients. The report gives us another insight into the strength or weakness of the employment situation in the US, however, the limiting factor of ADP employment change is that it is collected from only ADP’s clients within the private sector.
This limits the depth the report goes into the whole US employment situation.
10:30 AM
EIA Crude Oil Inventories
This weekly report by the Energy Information Administration shows US commercial crude oil inventories from domestic and imported sources, along with refinery utilization data. The market's reaction is based on simple supply and demand dynamics.
What to Expect
Higher-than-expected inventories usually lead to lower oil prices, suggesting a surplus.
Lower-than-expected inventories tend to raise oil prices due to potential supply shortages.
Thursday 3rd August
8:30 AM
US Initial Jobless Claims
The Department of Labor's weekly report shows changes in unemployment insurance filings, indicating the strength of the US labor market. It includes Initial Claims and Continuing Claims, reflecting new and ongoing unemployment insurance requests.
Although important, this weekly report holds less significance than the monthly employment reports coming out this week, which provide more comprehensive insights into the labor market.
9:45 AM
US S&P Services PMI
The US S&P Services PMI is a monthly economic indicator published by IHS Markit and associated with Standard & Poor's (S&P) division. It assesses the performance of the US services sector based on surveys of purchasing managers.
Last release (July 6th) came out broadly as expected.
10:00 AM
US ISM Services PMI
The ISM Services PMI is an economic indicator published by the Institute for Supply Management (ISM) in the US. It measures the performance of the services sector based on a survey of purchasing managers.
Last release (July 6th) ISM Services PMI came out higher than forecast at 53.9 which sent the US Dollar up.
S&P vs ISM Services PMI
Again, both gauges use a diffusion index (figure out of 100. 50 and above signifies expansion, whereas below 50 shows contraction).
At 400 companies with a typical response rate of 85%, S&P Global's service sector survey panel is thought to be larger than the ISM's panel size, which was previously stated at 300. The ISM services report covers any activity outside of the manufacturing sector, and not exclusively services. The weighting of various sectors is also different.
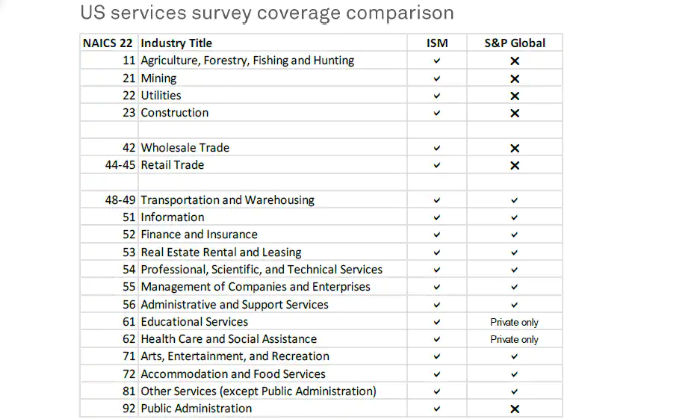
(Data provided by S&P Global)
What to Expect
Markets would like to see a little cooling in the Services PMI, as it has proven resilient in the face of monetary tightening. However, with the constant threat of a hard landing looming over the US economy, the reaction to this data can be skewed.
Friday 4th August
8:30 AM
US Nonfarm Payrolls
US Nonfarm Payrolls is the most heavily watched employment report for the United States; it is conducted by the BLS and released on the first Friday of the month. The report covers both government agencies and the private sector and excludes agriculture, private households, and certain nonprofit organizations.
The BLS surveys approximately 140,000 businesses, considerably less than the ADP report; however, NFP covers a wider range of companies than ADP as it looks at more than just the private sector.
This economic indicator is considered a lagging indicator as it shows the health of employment in the United States for the prior month.
The survey the BLS issues is called the Establishment Survey (CES), the questions of the survey are as follows:
- How many people were on your company’s payroll during the pay period that includes the 12th of the month?
- How many hours did your employees work during that pay period?
- What were the total earnings for your employees during that pay period?
- Did your company make any changes to employment, such as hiring, firing, or recalling employees, during this month?
US Unemployment Rate
The Unemployment Rate is measured using data collected through the Current Population Survey (CPS), which is conducted by the US Census Bureau for the Bureau of Labor Statistics.
This survey is based on a sample of households across the country and includes individuals aged 16 and older.
The headline unemployment number is taken from the ‘U-3 Unemployment Rate. This shows the percentage of unemployed people actively seeking employment. However, it is worth noting that the report also shows the ‘U-6 Unemployment Rate’, which includes discouraged, underemployed, and unemployed workers in the country, and is seen by some as the ‘true’ unemployment rate.
There can be divergences between the Unemployment Rate and the Nonfarm Payrolls numbers, as the NFP number comes from the Establishment Survey (which surveys businesses directly), while the Unemployment Rate uses the Population Survey, which surveys households.
In the current position in the economic cycle, investors are weighing up 2 risks linked to employment:
Inflation: High employment in a tightening cycle can cause inflationary pressure, and indicate that the Fed still has some room to move interest rates higher in order to reduce demand in the economy.
Recession: On the other hand, weak employment can decrease the chances that the US will get through this tightening cycle without causing a recession.