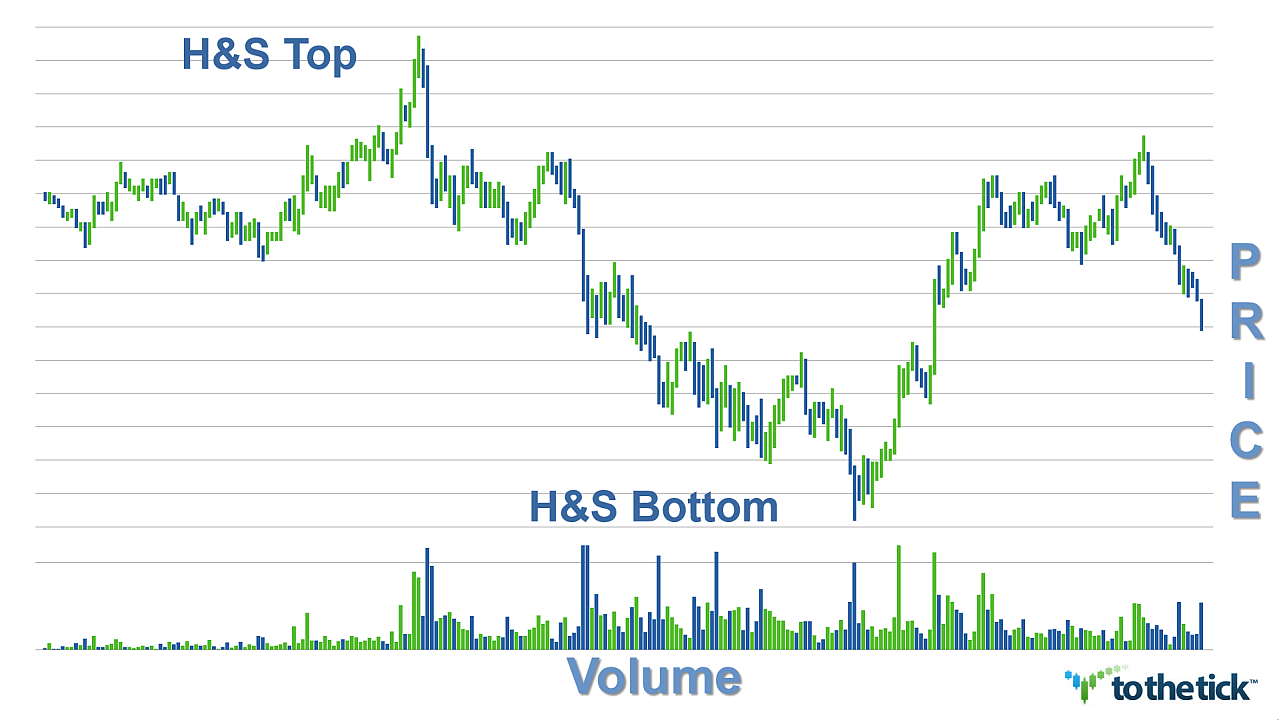
The Head & Shoulders is a powerful reversal price pattern seen in all markets, instruments, time frames, & price ranges. A completed Head & Shoulders reversal price pattern usually marks an intermediate or long-term change in trend.
Visually the Head & Shoulders patterns resemble a head with 2 shoulders right side up or upside down. The Spirit of any Head & Shoulders price pattern represents multiple efforts to break through an area of control & when it fails then traders look for price action to start trending in the opposite direction, completing the definition of a reversal. The textbook calls for 3 efforts & for the pattern to be somewhat symmetrical in it's appearance. This 'perfect' set up does happen but traders will also see numerous variations.
Please note: a full video review of each pattern independently is offered on the website with a text description and chart examples. This video is meant to be a supplemental review for these very powerful patterns.
This video includes both the Head and Shoulders Top & Bottom patterns & the objectives are:
- a 'cliff notes' perspective of the Spirit of a Head & Shoulders reversal
- a review of numerous nuances for the Head & Shoulders reversal
- quick look at numerous charts - various time frames & instruments
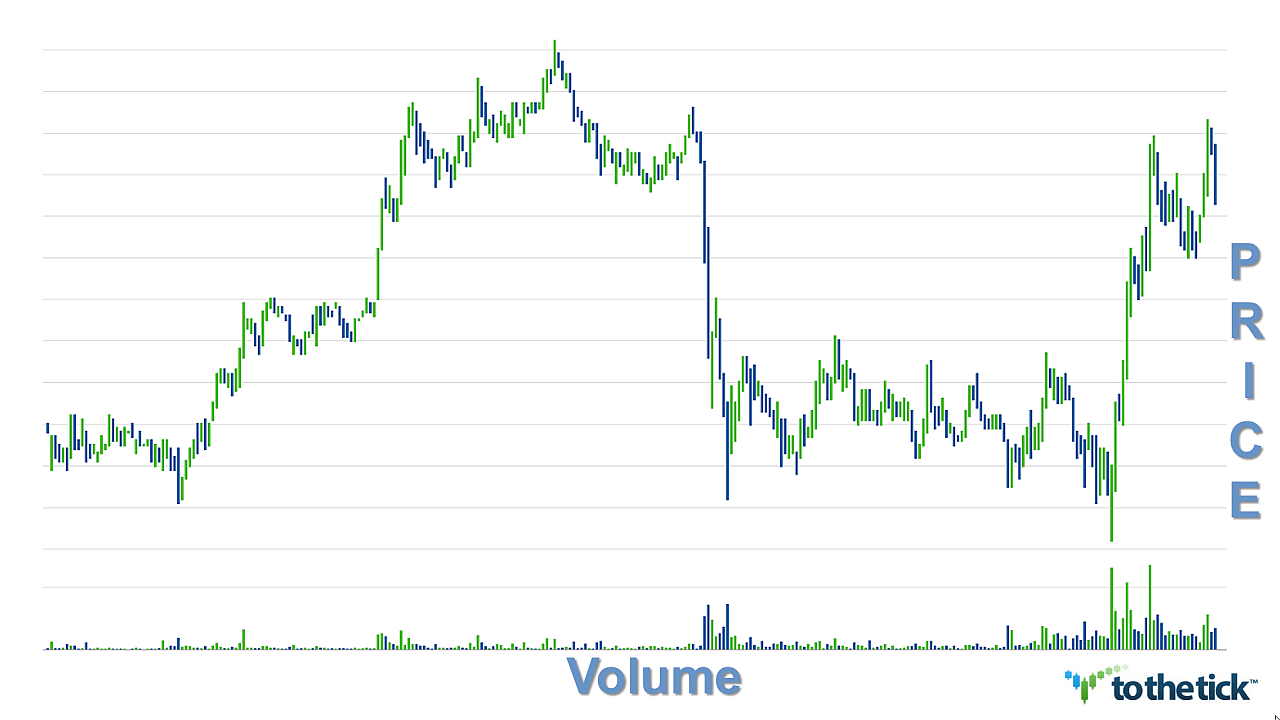
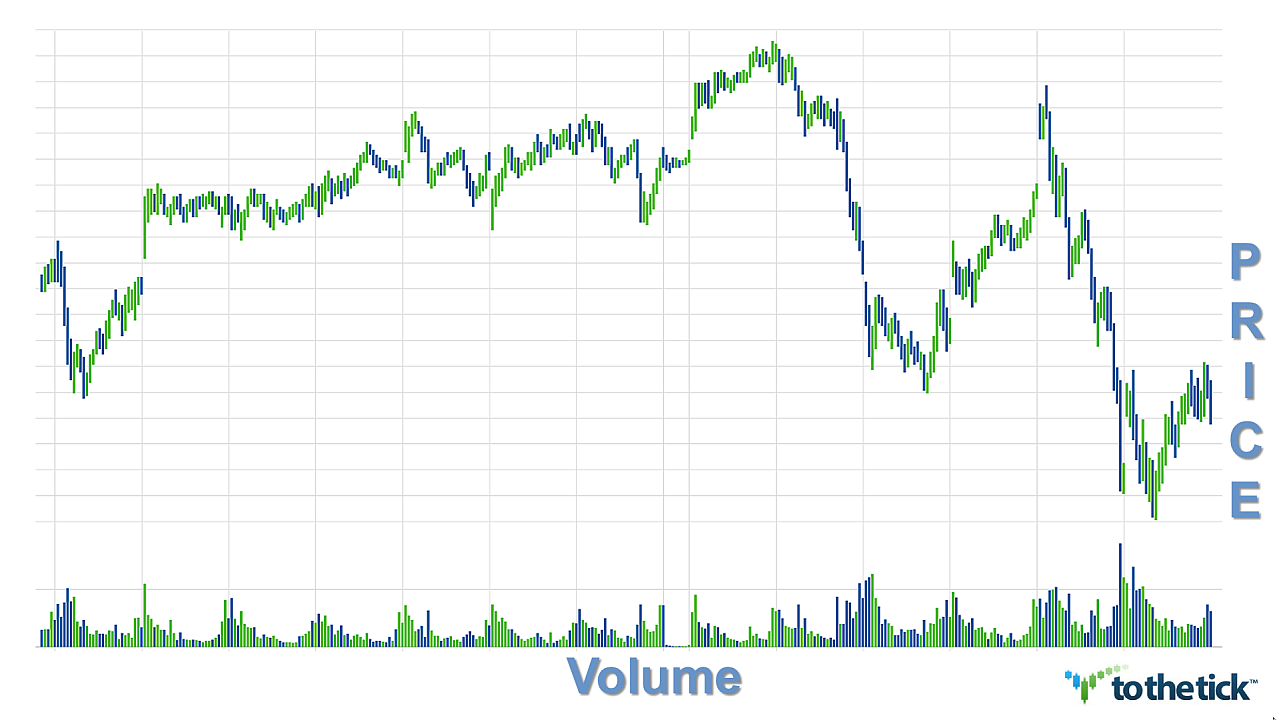
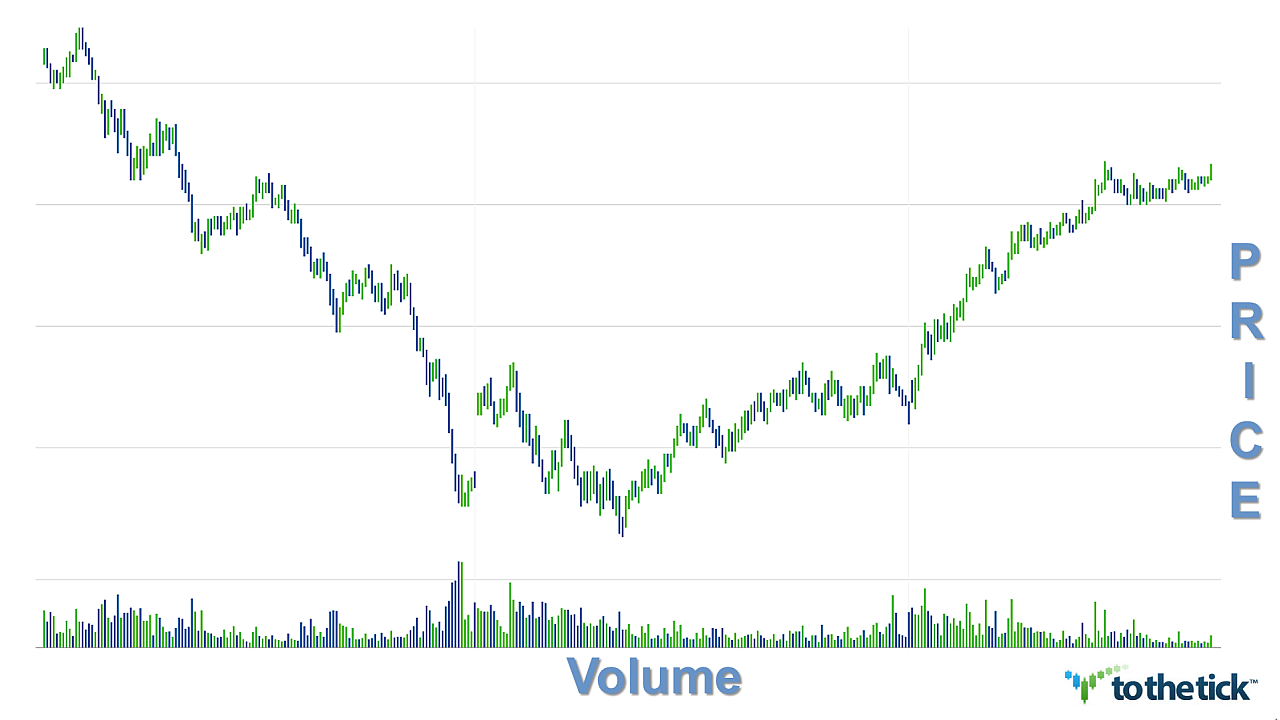
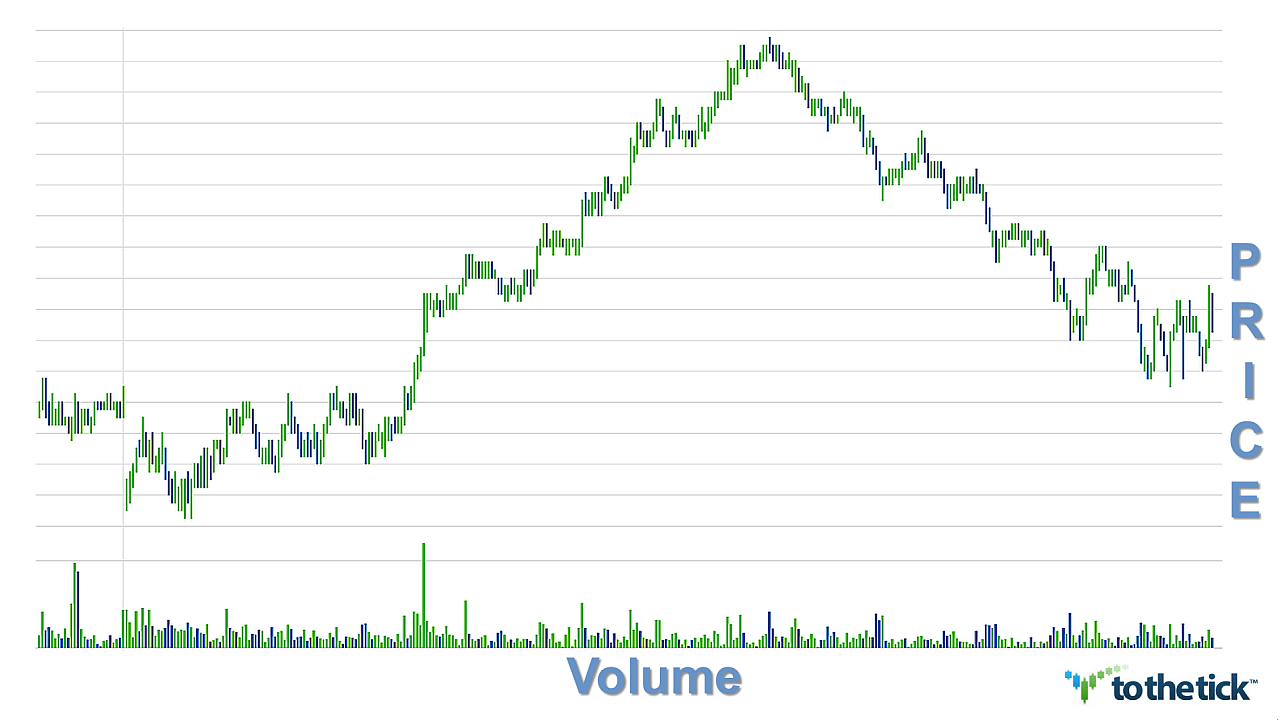
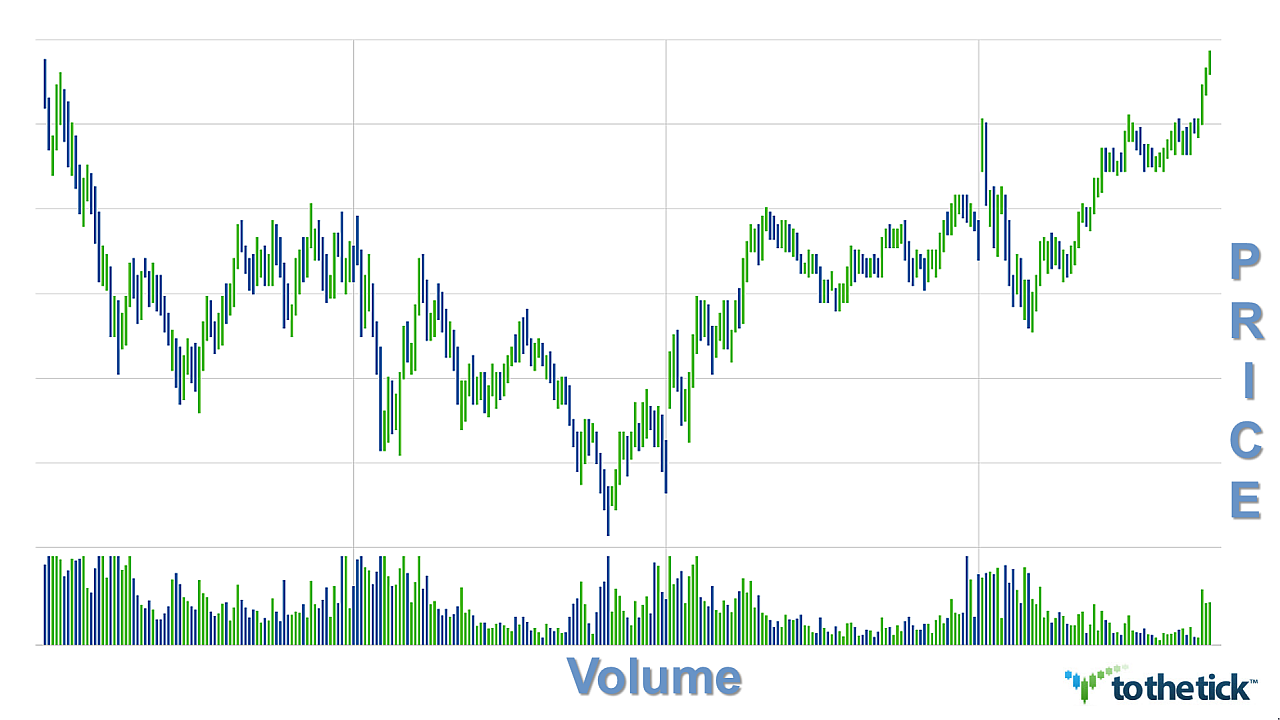
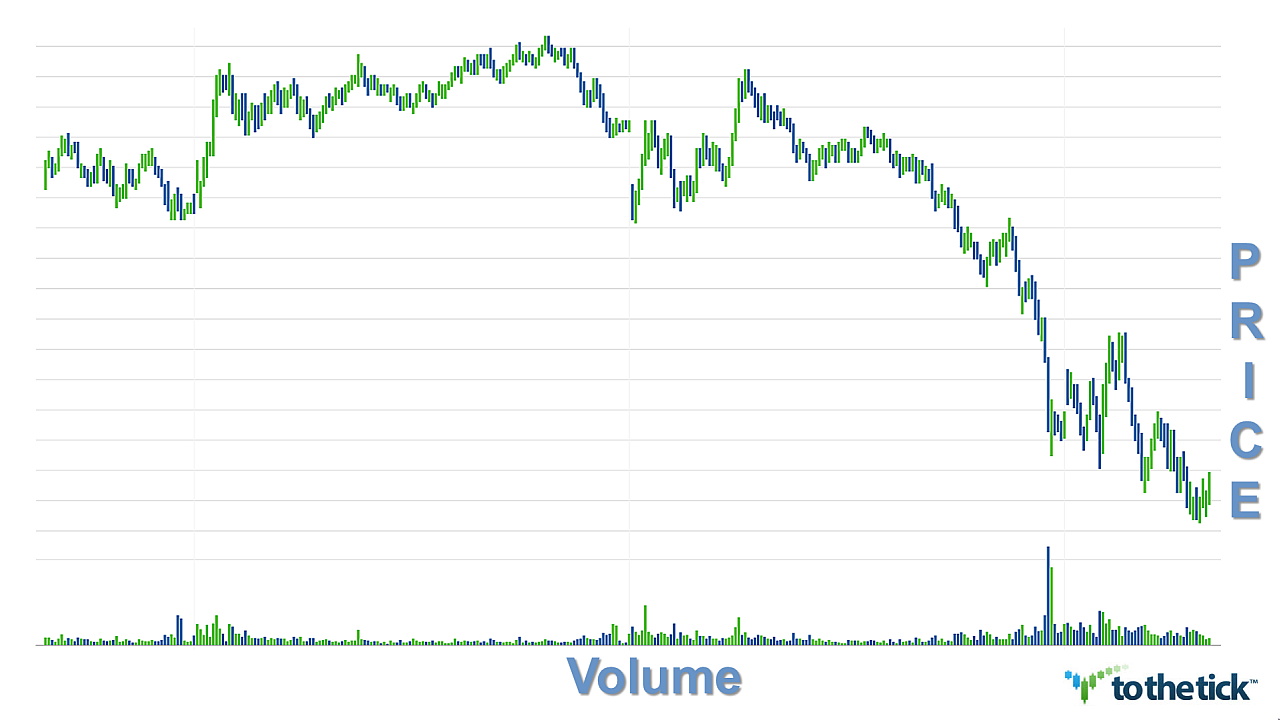
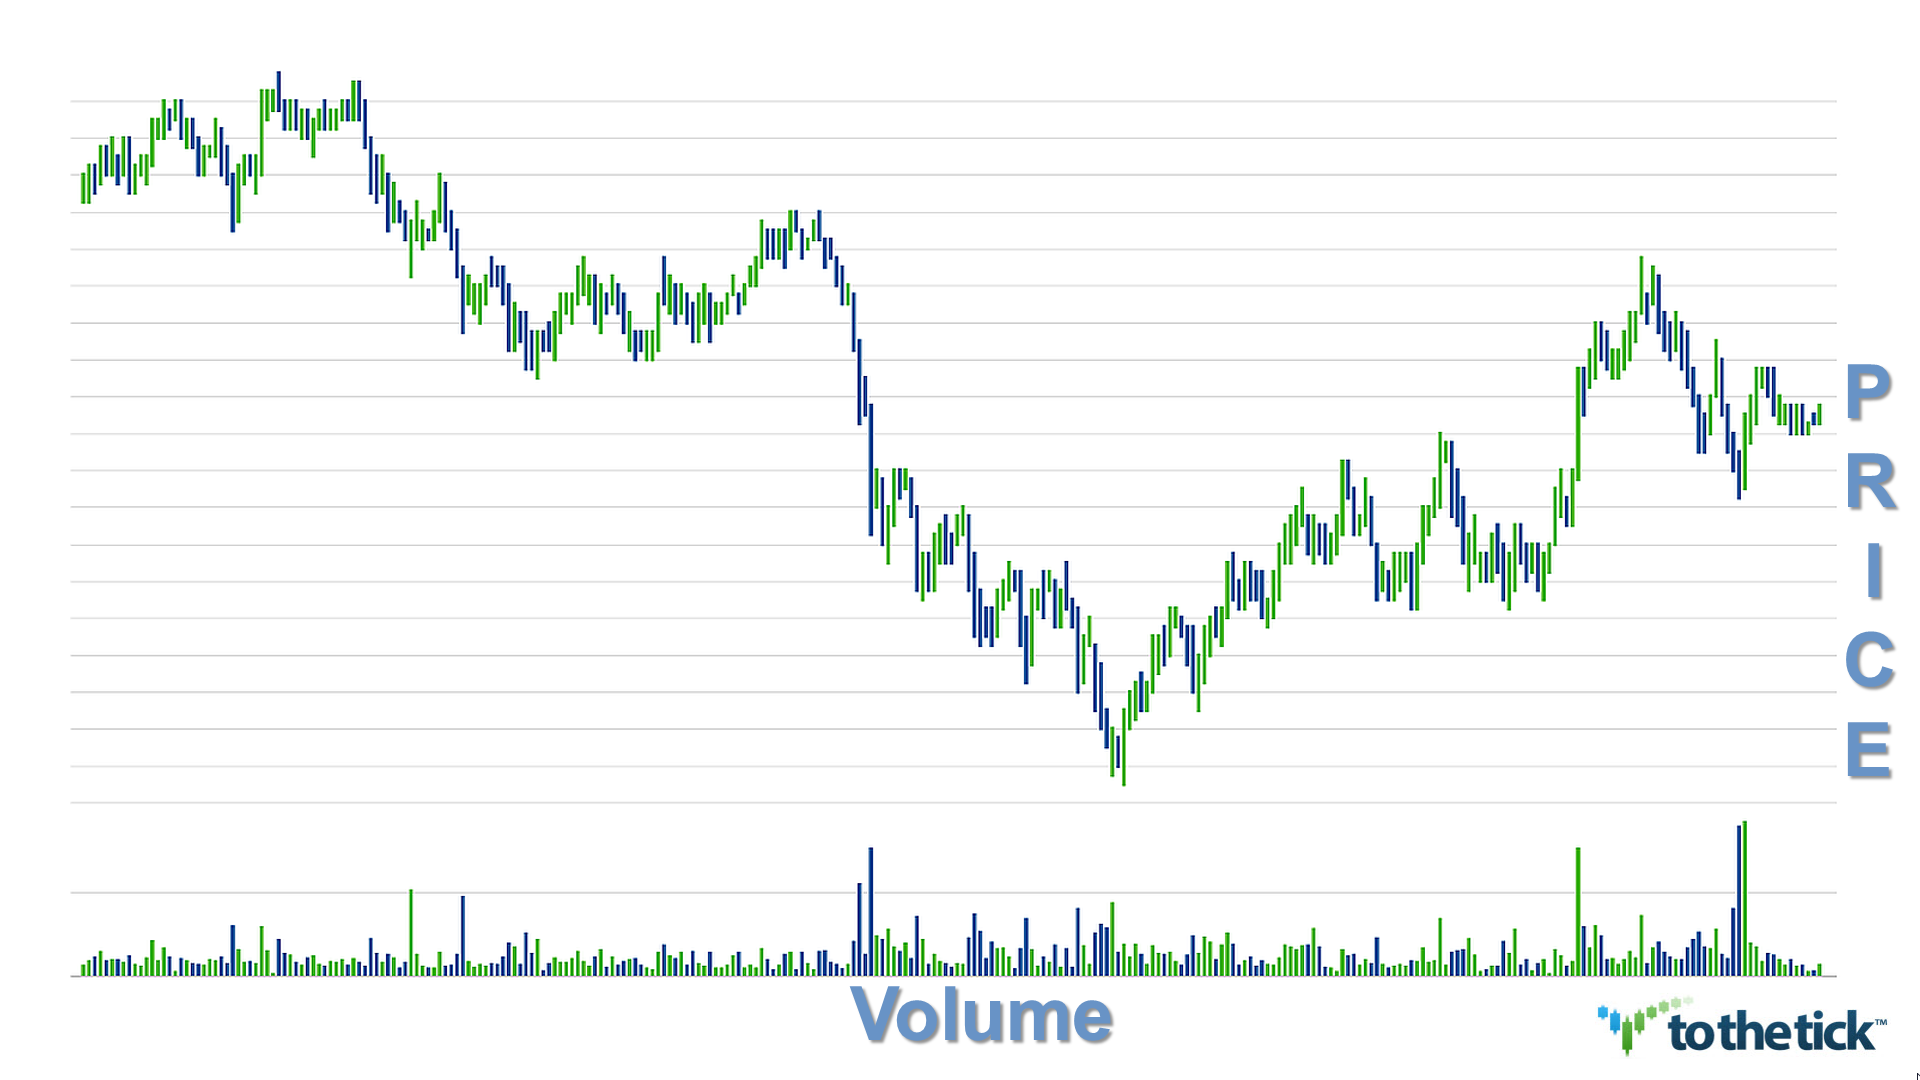
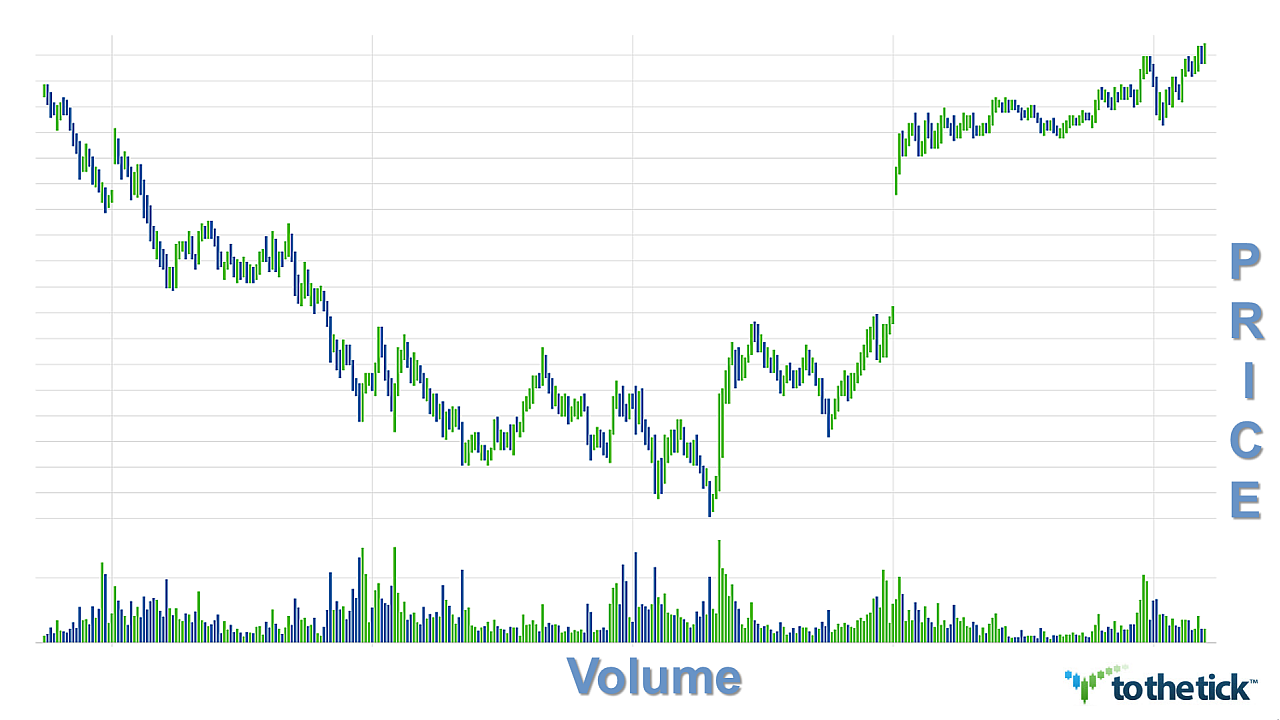
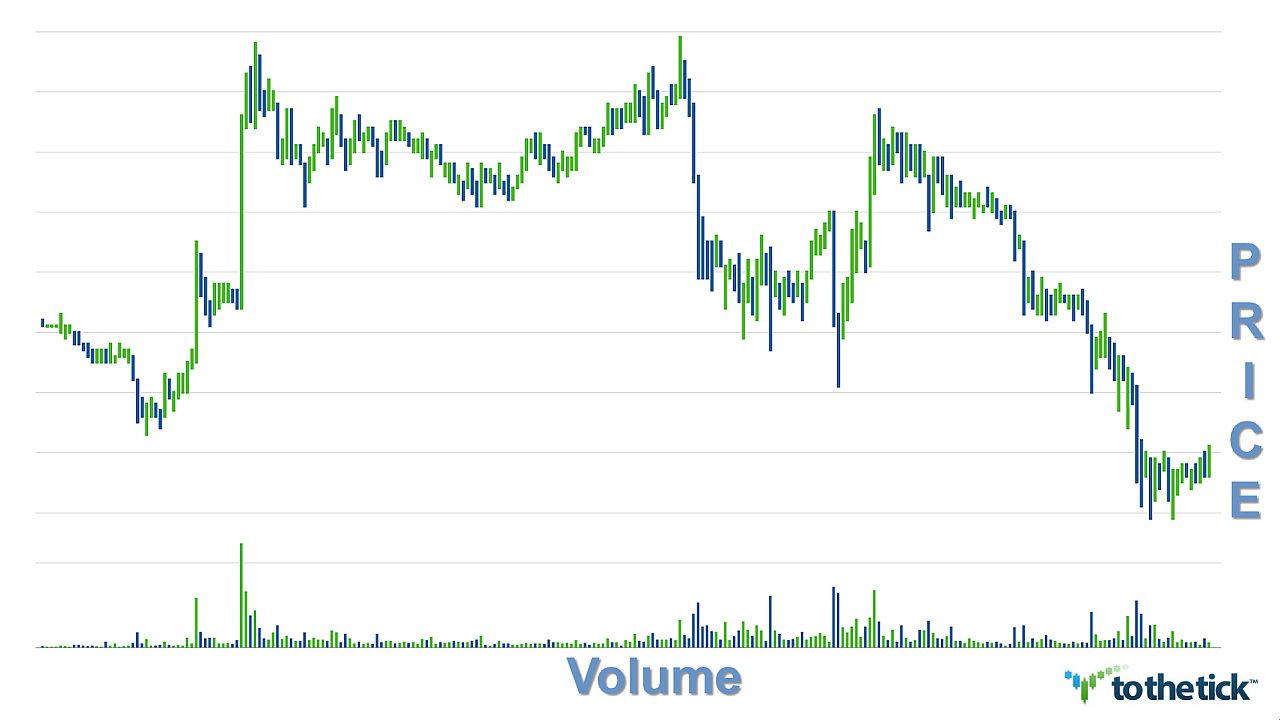
Learning the volume patterns inside the structure of a Head & Shoulders Reversal is of the utmost importance. These patterns represent a 'duel' between buyers & sellers and a fight for control of where price will go next. For this reason I offer study materials in different versions. Please see the fully annotated charts offered on the website for these patterns independently as they were part of this video review. Then as further study material I have also offered 10 'clean' unmarked charts of different instruments & time frames for your further study with this post. The more exposure to the concept with the different variations will help train a trader's mind to see these patterns. In addition there is also a bar by bar real chart data video review of a Head and Shoulders Top Reversal pattern in the Library , video #3.
Head & Shoulders Reversal pattern variations unmarked chart examples: