The Head & Shoulders Top is a powerful reversal price pattern seen in all markets, instruments, time frames, & price ranges. It presents with the immediate background environment as bullish with up-trending price action. The Head & Shoulders Top represents a basing period with multiple failed attempts by buyers to break through an area of resistance. This can be an indication that the established uptrend is losing strength & sellers may be gaining momentum. The Head & Shoulders Top usually marks an intermediate or long-term change in trend & is therefore considered to have a definite bearish bias.
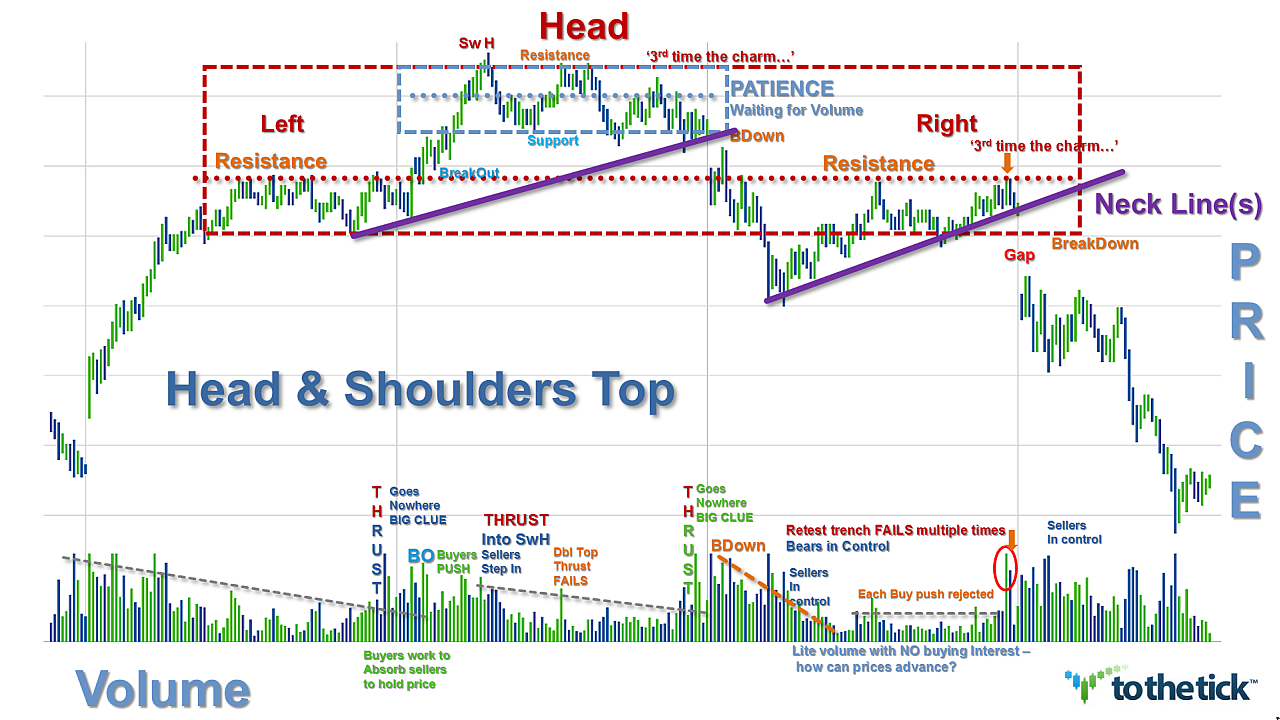
Visually the Head & Shoulders Top pattern resembles a head with 2 shoulders. It presents with three consecutive highs in price, ‘peaks’ with the middle one being the highest & the 2 outside ones being shorter & approximately equal. It also must have a moderate trough or swing low in-between each high. The price level of the lowest swing low establishes what is called a ‘neckline’ & creates the immediate support for the pattern. Typically as this pattern develops overall volume levels usually decline. After a 3rd effort traders will look for an expansion of volume from the bears &/or a decrease of buying volume to note conviction. The longer the pattern develops, the more significant the expected break.
There is a tendency for the Head & Shoulders Top to develop a high degree of symmetry but not always. Throughout development traders should be prepared for the pattern to possibly resemble a number of other patterns before the third top forms. The ‘spirit’ of the pattern highlights a battle between buyers & sellers & it may take some time & not look perfect. Ultimately the ‘final’ picture is not complete until a confirmed breakdown has cleared support. The beauty of the Head & Shoulders Top pattern is the potential for multiple entries along the path once a trader can see the sellers are in control. The final break of support &/or the angle of the neckline will often be a ‘trader nuance’ to determine. The inability to break through resistance is bearish but the bears have not won the battle until support has been broken.
Note that in the uptrend there may be many potential tops in price along the way up, but until significant support is broken, a reversal cannot be confirmed & traders should respect the trend.
Key points to formation in sequence:
- Background: price action trending Up
- 1st peak: marks highest price point in the current trend
- 1st swing low effort: sellers step in & lower price typically to a significant price area also seen in the background uptrend action. This 1st effort establishes the immediate support & defines a ‘neckline’.
- 2nd peak: the advance off the support usually occurs with lighter volume. Aggressive traders will look at volume activity for early signs of resistance from the bears. No resistance on the previous swing high & a higher peak is now made. The time period between peaks can vary but typically they are in-line with the symmetry of the instrument of choice. Note that there is NO confirmation of a reversal of trend at this point.
- Decline from 2nd peak: Traders are looking for selling pressure with the lack of buyers to accelerate off the 2nd peak. The type of activity seen in volume during the effort back to support is an indication of strength or weakness. Note that often traders participate with this ‘higher high Double Top Pattern’ & watch prices run right back into support instead of getting a breakdown. Or it is also quite common for prices to break through the 1st swing low price & establish a new lower low support line but then fail to drop much further. Therefore to be a Head & Shoulders Top the pattern must have a minimum of 3 swing high efforts creating resistance & 3 swing low efforts creating support. Keeping score on efforts makes the swing count at this point in the pattern ‘2 support - 2 resistance’.
- 3rd peak: the advance off the support usually occurs with even lighter volume. Resistance at the previous highs is the expectation & aggressive traders will look at volume activity for early signs from the bears along with the lack of buyers. Often this 3rd high price is in-line with the 1st swing high price of the pattern. Visually this price structure then resembles a head with a left & now a right shoulder. How close to equal is close enough is a trader’s nuance to choose while remembering the ‘spirit’ of the pattern is the duel between buyers & sellers and to be used as a guideline. Volume ‘thrusts’ are common. The time period between peaks can vary but typically they are in-line with the symmetry of the instrument of choice. Note that there is NO confirmation of a reversal of trend at this point.
- Decline from 3rd peak: Traders are looking for volume & selling pressure with the lack of buyers to accelerate down off of the 3rd peak. Surging volume is ideal; and again, the type of activity seen in volume during the effort back to support is an indication of strength or weakness & becomes more important with each subsequent effort. “Swing efforts now Count 3-3 & is the 3rd time a charm?”
- Support break: even after trading back down to support a trend reversal is not complete. Breaking thru support on this swing low price effort of the pattern & with conviction seen in volume completes the Head & Shoulders Top Reversal.
- Support turns into resistance: broken support becomes potential resistance. Often but not always, there is a test of this newly created resistance & this effort offers a final consideration for a short entry into a potential change of trend.
While this pattern is fairly straightforward it should be noted that traders often ‘jump the gun’. Not all repeated highs produce a change of trend & traders need to remember that the trend is in force until proven otherwise. Top formations can take some time and often it takes a break of a more significant support before a major change of trend. Patience is often a virtue. If a trader will give the pattern time to develop and look for the proper clues & then follow the guidelines, this chart pattern can be well-worth the effort of identifying & trading it.
Options for Trading the Head & Shoulders Top as a bearish reversal pattern:
There are 4 methods of trading this pattern & it depends on your trading style.
Most Aggressive traders will be looking for the 3rd peak in price as soon as the first 2 peaks show resistance & the swing lows are in place. As the action comes back to re-test this high resistance area aggressive traders will be diligently monitoring the volume action looking for clues to the selling pressure & lack of buyers. Entries in this area can work with a stop placement just above the highest high of the formation. Aggressive traders should be prepared for thrusting action used as a method of capturing supply right before a price break.
Aggressive traders may wait until a 3rd swing high is made & then monitor the action through the middle of the reverse pattern. The concept of this option is to identify the reversal price action as being contained in a support/resistance ‘box’. Traders monitor the middle ‘muddy trench’ of the spread in price offered by the pattern for an entry once the bears control. Stop placement can be fairly tight just above the trench zone. This can be an accurate trade looking to capitalize on a breakdown & potentially a new bearish trend but without the risk of the most aggressive option.
Classic traders will look for a short entry with the breakdown of the neckline or immediate pattern support. Stop placement right above the neckline price.
Conservative traders will watch the breakdown & look for a re-test of that new breakdown resistance price to hold for full confirmation of the Head & Shoulders Top reversal pattern. Stop placement right above breakdown price. Note that this method of waiting for this pullback may or may not offer an opportunity but statistically it has a high % of success when it does present.
The aggressive trading methods can highly increase the profit potential of any Head & Shoulders Top & may offer more than one entry. However, the trader needs to assess whether the ‘extra’ profits choosing an earlier entry offers a decent risk:reward over waiting for some confirmation of action based on clearing a defined price support. Traders choosing these options should look for strength from sellers in combination with the lack of buyers. It cannot be stressed enough that volume is a major key & an expansion of bearish volume aids confirmation.
False breakouts do happen & confirmation needed is always a traders’ choice. Several methods that apply here for either intrabar &/or close bar options offered in sequence: breakdown below support price, retrace holds new resistance line, price clears breakdown swing low price, price clears next swing low of background uptrend price action, larger chart combination.
Stop placement considerations for all trade entry choices can be aggressively lowered after the breakdown of the price.
Measured Move Target based on structure of the Head & Shoulders Top Reversal Pattern
- Head & Shoulders Top Pattern measure (subtracted from) Breakdown price = target
- Head & Shoulders Top Pattern measure = (swing high price of pattern (minus) swing low price of pattern)
Since the Head & Shoulders Top Reversal Pattern once confirmed has such a high degree of success indicating a change of trend, there are additional target considerations based on the knowledge that history repeats. All traders can look for tests on each of the swing lows seen in the immediate background uptrend price action. At any point & for all of these options, traders should gauge the continued conviction of the bears based on momentum. If momentum is strong stick with the trade, if they get ‘lazy’ then consider taking profits & possibly look for a re-entry.
Examples: Head & Shoulders Top Reversal Pattern
1st effort Failed to Breakdown hard & re-tested the Left shoulder price area = totally symmetrical
Took awhile but Patience did pay off … & this downtrend went on ….
Remember when defining the ‘muddy trench’ use the most worked price action.
The concept of the LEFT shoulder is a key # resistance / support for ANY reverse pattern
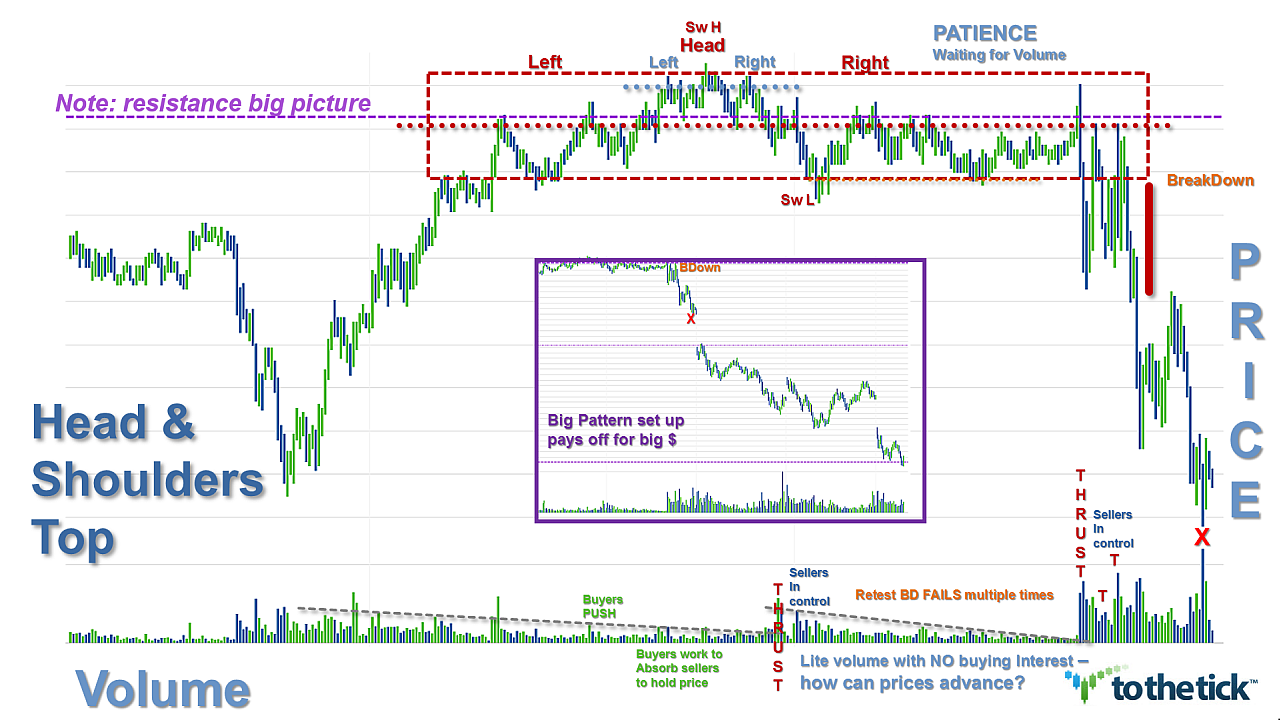
Took awhile but Patience certainly paid off …see inset for follow thru X marks spot
Note numerous options to define the reverse rectangle. ALL of them worked eventually…
Notice opts with swing activity on the muddy trench which is established early in the pattern…