The V Bottom is a powerful reversal price pattern seen in all markets, instruments, time frames, & price ranges. It is an unusual & very distinctive pattern in that there is a sharp trend switch from one direction to the other ‘seemingly’ without warning. A market top or bottom is often difficult to identify but this pattern represents an aggressive shift in momentum and typically this turn in price direction is with high volume at or just after the turn. The price action presents with the immediate background environment as bearish with strong down-trending action. The V Bottom usually marks an intermediate or long-term change in trend & is therefore considered to have a definite bullish bias.
Visually the V Bottom price action resembles the letter "V". Traders often refer to them as an ‘ugly’ head & shoulders bottom reversal pattern. The immediate bearish trending action in the background has the V Bottom swing high to low price action fitting in a steep channel with a straight line run of price. This creates the reversal potential for price to develop with a high degree of symmetry & an aggressive trader is looking for an equally sharp ascent off the low trough.
A break of the upper channel line is considered to be the first sign of a break of resistance for the V Bottom. Traders may also determine a horizontal immediate resistance line based on the background price action pre-ceding the trough creation. The idea is to determine a ‘neckline’ that denotes resistance. Typically the trough, or immediately after, traders will look for an expansion of volume from the bulls to note conviction. The spirit of the pattern highlights a ‘dramatic’ episode with a rapid exchange between buyers & sellers & it may not look perfect. Ultimately the ‘final’ picture is not complete until a confirmed breakout has cleared resistance. The beauty of the V Bottom pattern is the potential for multiple entries along the path once a trader can see the buyers are in control. The final break of resistance &/or the angle of the neckline will often be a ‘trader nuance’ to determine. Even after trading up through resistance a trend reversal is not complete. Breaking through resistance & with conviction seen in volume completes the V Bottom Reversal. Often but not always, there is a test of this newly created support & this effort offers a final consideration for a long entry into a potential change of trend.
Note that in the downtrend there may be many potential bottoms in price along the way down, but until significant resistance is broken, a reversal cannot be confirmed & traders should respect the trend.
While this pattern is fairly straightforward it should be noted that traders often ‘jump the gun’. While spikes or thrusts offer a lot of drama they do not necessarily offer a good risk:reward ratio. In addition, they do not all produce a change of trend & traders need to remember that the trend is in force until proven otherwise. Bottom formations can take some time and often it takes a break of a more significant resistance before a major change of trend. Patience is often a virtue.
Options for Trading the V Bottom as a bullish reversal pattern:
First note that often this pattern happens so quickly a trader is not offered much time to recognize it and then respond. It is not a pattern for the faint of heart and it is highly recommended to have a very defined plan in place with risk:reward clearly determined. There are 4 methods of trading this pattern & it depends on your trading style.
Most Aggressive traders will be looking for an entry long before or with a break of the sloping lower parallel or bearish channel trendline. Entries in this area can work with a stop placement just below the lowest low of the formation. Aggressive traders should be prepared to take quick action both in profits and in stop adjustment with any additional drama as thrusting action is the ‘spirit’ of the pattern.
Aggressive traders may wait & then monitor the action through the middle of the reverse pattern. The concept of this option is to identify the reversal price action as being contained in a support/resistance ‘box’. Traders monitor the middle ‘muddy trench’ of the spread in price offered by the pattern for an entry once the bulls control. Stop placement can be fairly tight just below the trench zone. This can be an accurate trade looking to capitalize on a breakout & potentially a new bullish trend but without the risk of the most aggressive option.
Classic traders will look for a long entry with the breakout of the neckline or immediate pattern resistance. Stop placement right below the neckline price.
Conservative traders will watch the breakout & look for a re-test of that new breakout support price to hold for full confirmation of the V Bottom reversal pattern. Stop placement right below breakout price. Note that this method of waiting for this pullback may or may not offer an opportunity but statistically it has a high % of success when it does present.
The aggressive trading methods can highly increase the profit potential of any V Bottom & may offer more than one entry. However, the trader needs to assess whether the ‘extra’ profits choosing an earlier entry offers a decent risk:reward over waiting for some confirmation of action based on clearing a defined price resistance. Traders choosing these options should look for strength from buyers in combination with the lack of sellers. It cannot be stressed enough that volume is a major key & an expansion of bullish volume aids confirmation.
False breakouts do happen & confirmation needed is always a traders’ choice. Several methods that apply here for either intrabar &/or close bar options offered in sequence: breakout above resistance price, retrace holds new support line, price clears breakout swing high price, price clears next swing high of background downtrend price action, larger chart combination.
Stop placement considerations for all trade entry choices can be aggressively raised after the breakout of the price.
Measured Move Target based on structure of the V Bottom Reversal Pattern
- V Bottom Pattern measure (added to) Breakout price = target
- V Bottom Pattern measure = (swing high price of pattern (minus) swing low price of pattern)
Since the V Bottom Reversal Pattern once confirmed has such a high degree of success indicating a change of trend, there are additional target considerations based on the knowledge that history repeats. All traders can look for tests on each of the swing highs seen in the immediate background downtrend price action. At any point & for all of these options, traders should gauge the continued conviction of the bulls based on momentum. If momentum is strong stick with the trade, if they get ‘lazy’ then consider taking profits.
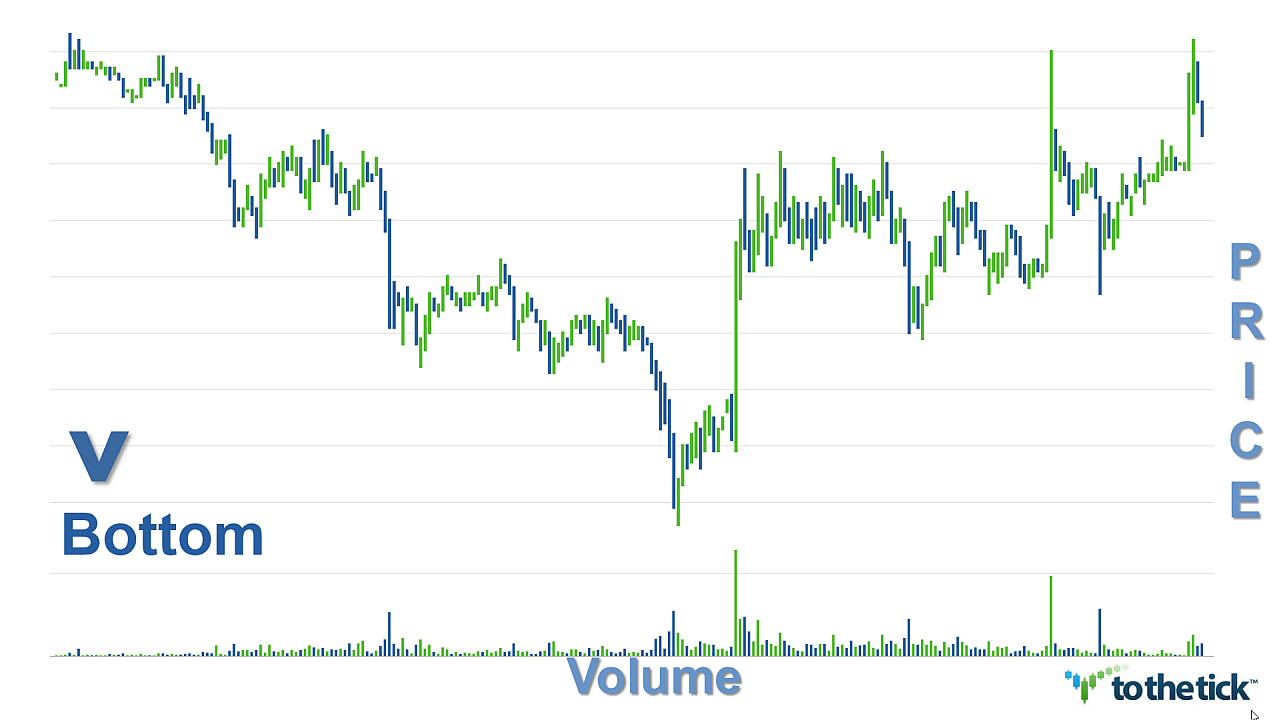
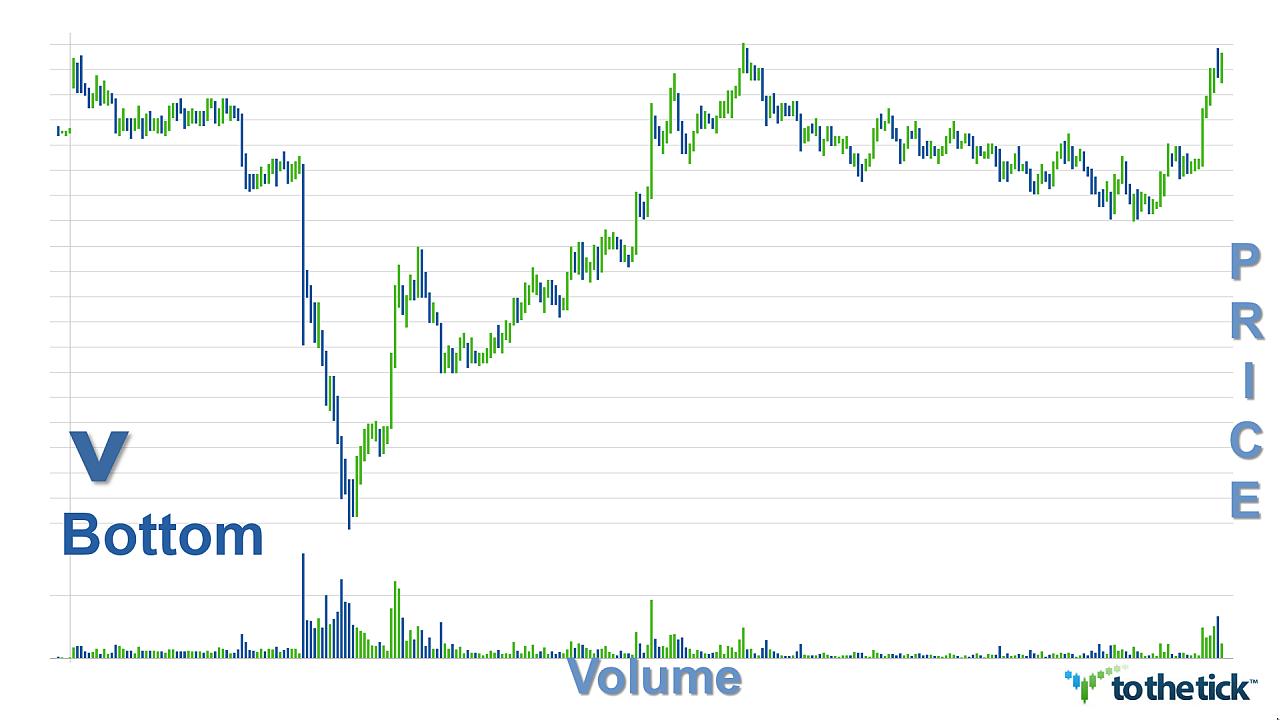
Clean charts, different instrument and time frame. As you review, mark the support and resistance & make special note of the volume switch between sellers and buyers. Do you see the 'capitulation selling' & then when the bulls totally take over? Where does that 1st energy PUSH run out of momentum? When does resistance really turn into a proven support? Where in the formation of these dramatic visual V's would you feel comfortable taking entries?
Examples: V Bottom Reversal Pattern