Topic: Working Trend Reversal Patterns with real chart data
Objective: 3rd video in the library working a larger reference chart with progressive data on the same instrument
Focus:
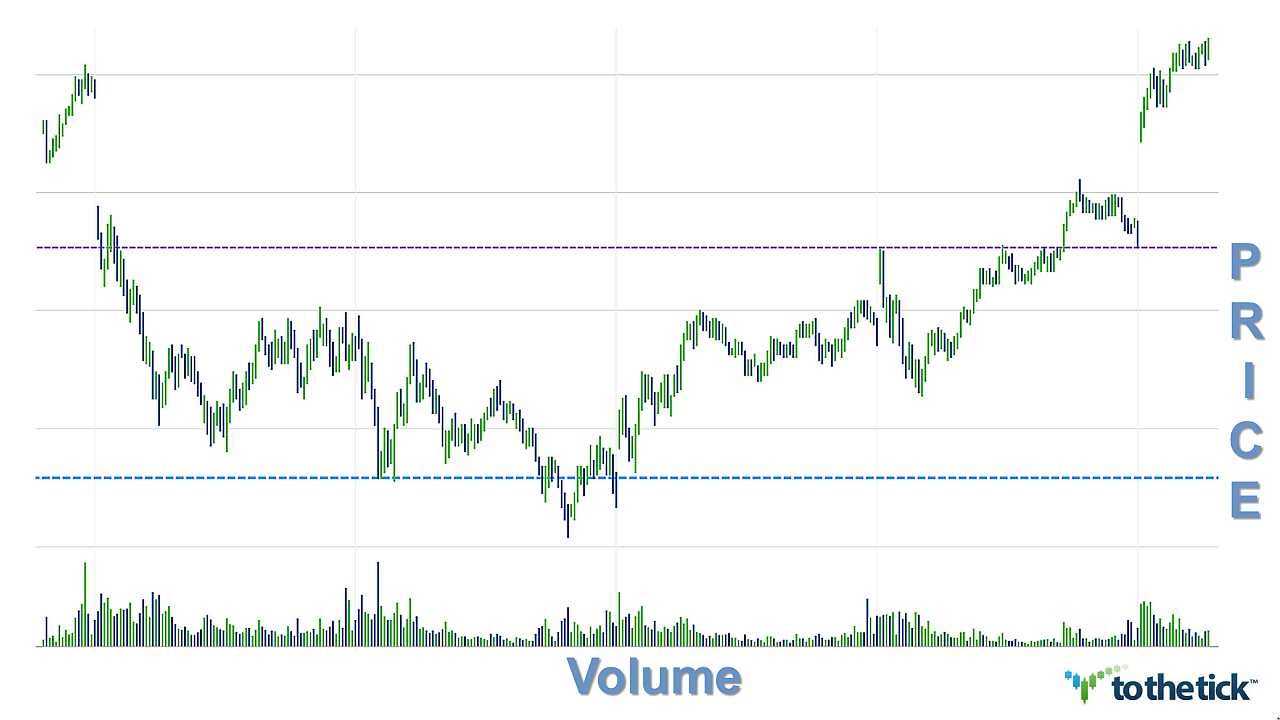
- video 1 worked from a new bullish breakout with a large individual bullish continuation pattern: 'tomahawk'.
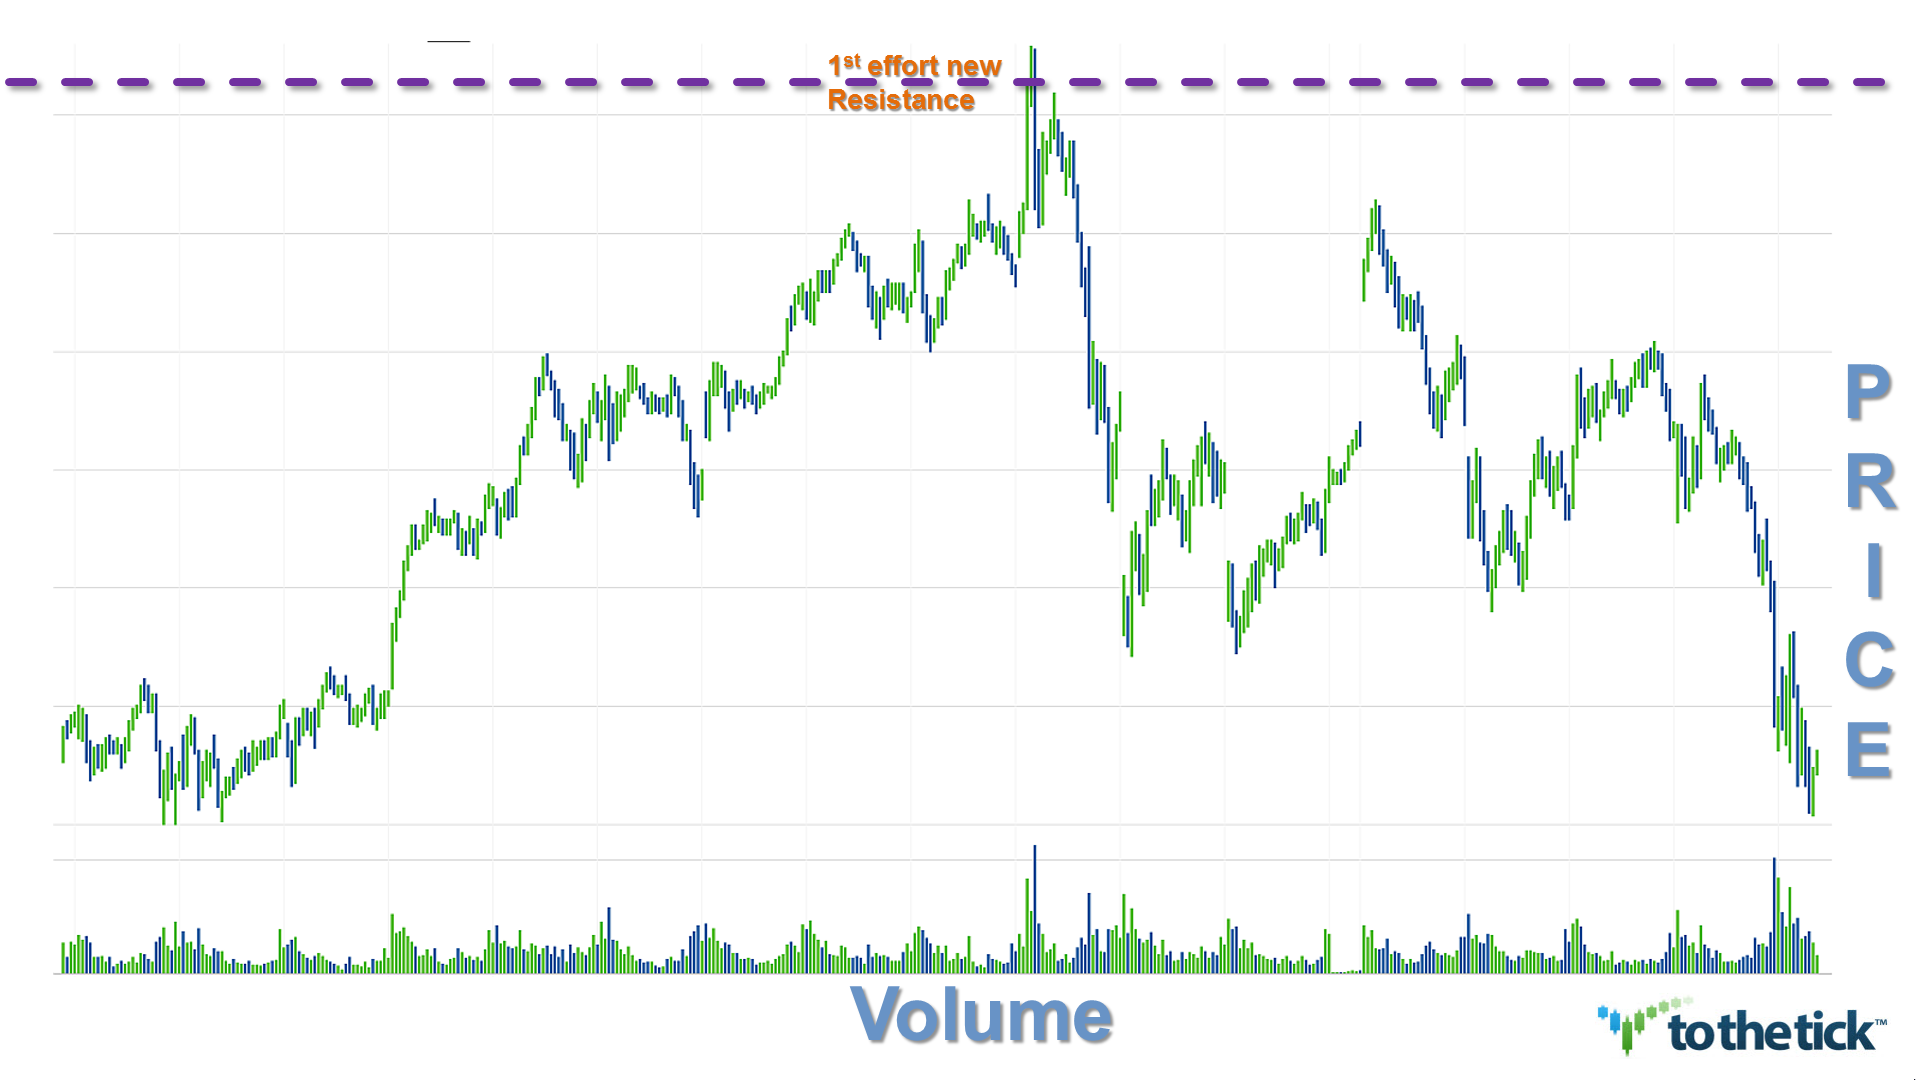
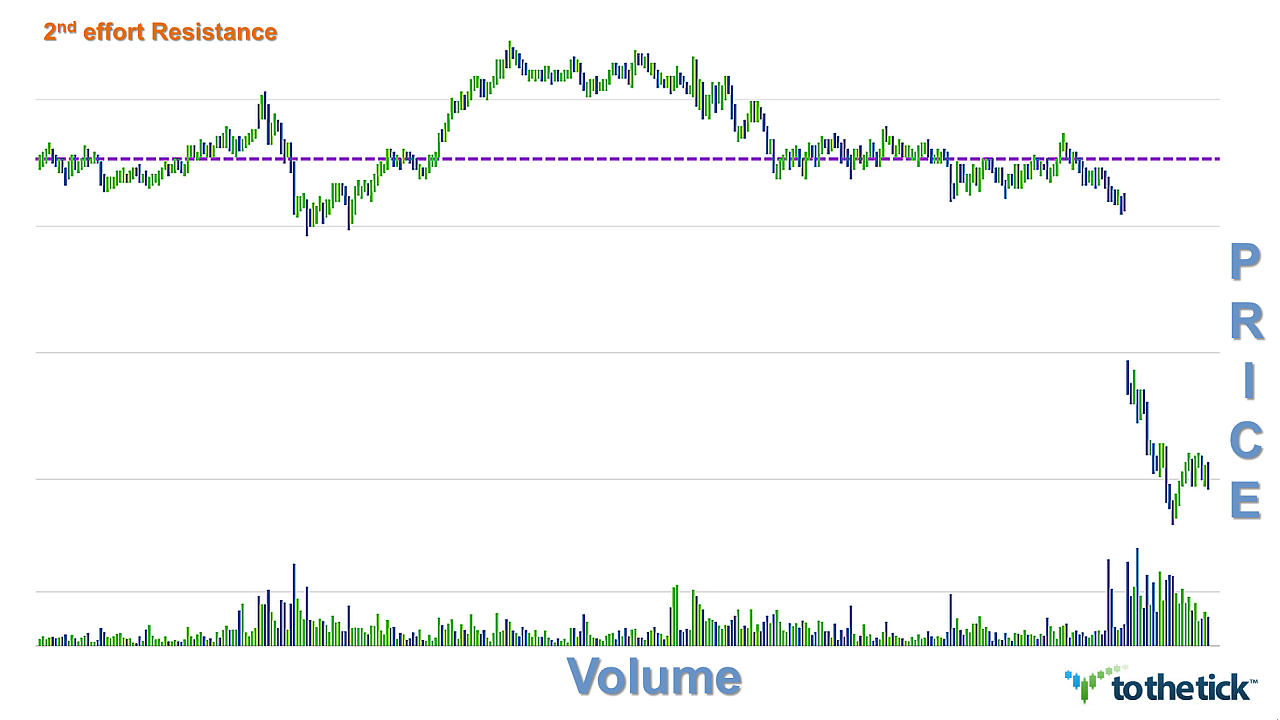
- video 2 worked when a 1st effort into new resistance turned/reversed & changed into a bear trend with room to continue.
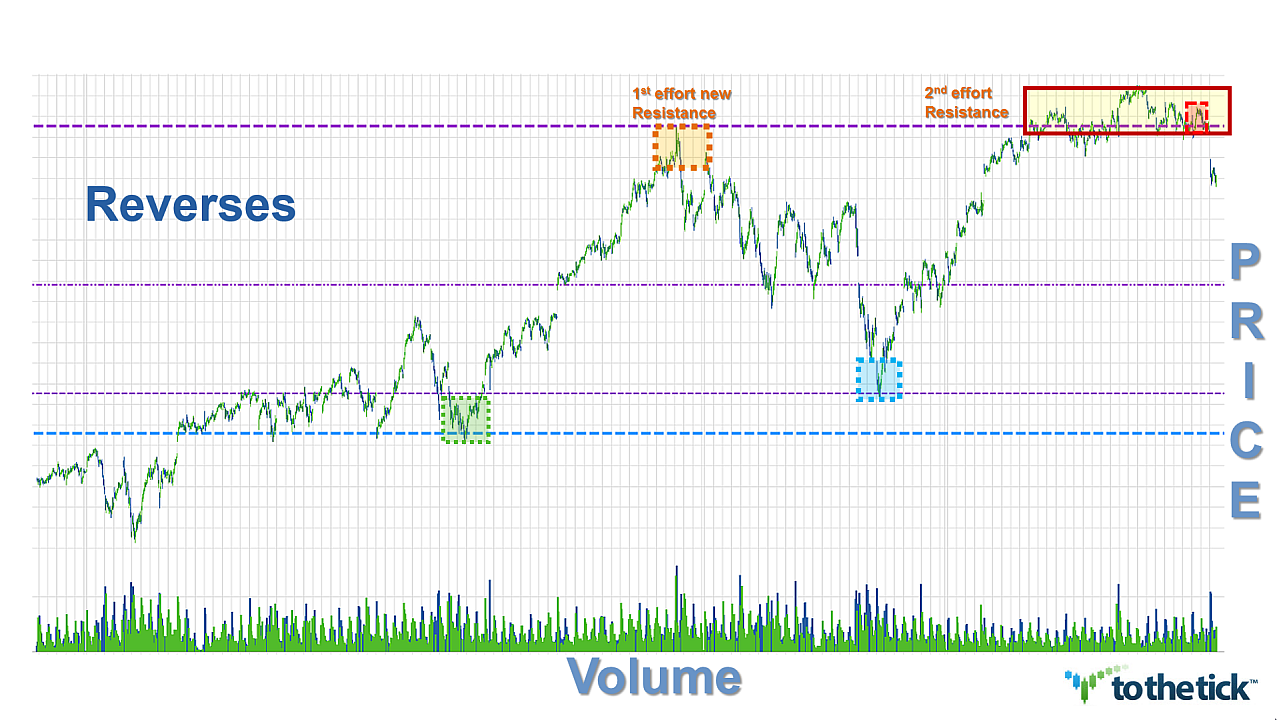
- video 3 works with updated information to our reference chart & looks into the detail at smaller time frames & dollar ranges during our major reverse areas.
Attachments:
note that reference points are all marked the same across all charts
- 'pinched' reference chart current updated picture with reverse detail areas highlighted in boxes as outlined in video
- clean screenshots seen in video for each of the detailed box areas
Please review the following basic information & understand why building on your ability to review price action in various patterns & with different areas of focus increases your learning curve effort & 'stacks your deck'.
Continuation patterns indicate a pause in trend & that the previous direction of the trend will be resumed after the consolidation. The reasons for both continuation patterns & reversal patterns are that the trend, whether it is up or down, cannot continue in the direction in which it is travelling forever. There has to be either a pause in time & in price or a change in price action direction. Visually price action 'creates' chart patterns in different forms or shapes. Learn to correctly identify; & then follow the structural guidelines they offer, & these patterns will subsequently help you to become a successful trader.
The basics of doing any chart analysis are that we know that history repeats itself. Chart patterns take time to form. Reviewing charts allows us to choose an instrument & focus our study on the previous process involved in creating a price Trend as well as what it takes to Reverse or 'turn a trend'. This background research with the anticipation of patterns repeating offers traders confidence. For any trader, trading any instrument, it is highly recommended to do your due diligence & Focus attention on the price history of your chosen instrument.
Bullish/ Bearish Continuation & Reversal patterns offer many trades in any time frame using any instrument and in any market. Their versatility and repetition offers the focused trader many profitable opportunities regardless of trading style. These library videos are meant to be a starting tool for traders looking to learn how to identify and work price action patterns using real chart data. For this reason additional videos will be added periodically to the library to assist traders in an on-going effort in 'putting it all together'.